Describing ONS datasets with standard vocabularies

Last week I published some open data publishing principles that can inform further development of the Data Discovery Alpha. This week I’ve begun turning those principles into actionable recommendations.

For example, if we want reuse rights to be clear then how do can licensing be published in both human and machine-readable formats? This is something I’ve previously explored quite extensively at the Open Data Institute (ODI), so there’s plenty of practical guidance to build on.

Similarly, if we want datasets to be discoverable, always be presented in context and legible to users, then what information and metadata might need to be presented?

I’ve begun the process of developing this guidance by:

  • exploring the metadata already collected and managed by the ONS, and some of the ongoing work to improve it
  • reviewing existing metadata vocabularies to determine how well they align with the needs of the ONS and its reusers
  • comparing the metadata recommended by tools like open data certificates and some standard metadata profiles

You can see my brief comparison of open data certificates, Data on the Web Best Practices and some EU metadata profiles. There’s a great deal of agreement in terms of recommended metadata but there are some differences in what is considered to be mandatory.

The 3 main metadata vocabularies that I’ve been looking at are:

  • Data Catalog Vocabulary (DCAT) — which is supported by data.gov.uk, data.gov, all of the major open data portals and a variety of other open data tools. DCAT is based on standard vocabularies like Dublin Core that have been in use for many years.
  • DCAT-AP — an extension to DCAT that recommends the use of some additional metadata elements to ensure that data can be discovered and reused across different data portals in the EU
  • STAT-DCAT — an extension of DCAT-AP that adds support for describing statistical datasets. This work has been lead by Eurostat and others in the statistical open data community

Collectively these standards describe how to:

  • publish descriptions of datasets and their distributions (downloads)
  • publish the structure of statistical datasets, for example, information on the dimensions and attributes used to report on observations
  • relate datasets to supporting documentation, version notes, and other material relevant to reusers

This is exactly what we need in order to present data in context and to ensure that users can understand how the data is structured.

A variety of formats can be used to publish this metadata, but JSON-LD looks like a strong candidate for a common, baseline format.

To start testing out how well this works in practice I’ve started putting together some examples.

The examples include exploring Google’s recently launched support for describing datasets using Schema.org. This is at an early stage but is very closely aligned to existing standards and formats.

Collectively this looks like a promising way forward, and should provide a solid foundation for implementing the open data publishing principles.

The next steps are to test this out with more examples, particularly around describing statistical datasets. I’m also keen to explore how CSV on the Web can be used to help provide metadata for the CSV files published by the ONS.

As ever, if you have feedback or comments then please get in touch.

Some open data publishing principles

This week I’ve started working with the Digital Publishing team at the ONS. They’re currently hard at work on the Data Discovery Alpha exploring how to better support users in finding and accessing datasets.

As our national statistics body and the UK’s largest producer of official statistics, it’s important that the ONS is seen as an exemplar of how to publish high-quality data. Open data from the ONS should be published according to current best practices. The team have asked me to help them think through how these apply to the ONS website.

This is an exciting opportunity and I’m already enjoying getting up to speed with everything that’s happening across the organisation. It’s also a big task as the ONS publish a lot of different types of data. For example, it’s not just statistics, there’s also geographic datasets.

To help frame the work that we’ll be doing I’ve drafted a few high-level principles which I thought I’d share here.

The principles provide an approach for thinking about open data publishing that focuses on the outcomes: what it is that we want to enable users to do?

Importantly, the principles are aligned with the Data on the Web Best Practices, the recommendations in the Open Data Institute’s Open Data Certificates, and the Code of Practice for Official Statistics.

Obviously, implementing all this will also draw on the open principles enshrined in the GDS service manual. For example, building on open standards.

  1. Make data discoverable

Datasets need to be discoverable on the ONS website and the team are continuing to put a great deal of effort into that.

But there are various ways in which discovery can happen and not all of those need be on the ONS website. Users might find data via Google and/or specialised data aggregators and portals.

This means that data needs to have good quality descriptive metadata and be easily indexed by third-parties

  1. Ensure reuse rights are always clear

Data published by the ONS is reusable under the Open Government Licence (OGL). But individual datasets may be derived from data provided by other organisations. This means re-users may need to include additional attribution or copyright statements when reusing the data.

While these requirements are all documented, the rights of re-users, along with any obligations should be clear at the point of use.

And, as data may be distributed by third-parties, those licensing and rights statements should also be machine-readable.

  1. Help users cite their sources

Clear attribution statements and stable links can do more than help users fulfil their obligations under the OGL.

Easy ways to reference and link to datasets will encourage users to cite their sources. This provides another route for potential users to discover datasets, by following links to primary sources from analysis, visualisations and applications.

Stable links, clearly labelled citation examples, and supporting metadata can make all of this easier for reusers.

  1. Always present data in context

Access to data only gets you so far. Deciding whether the data is fit for purpose and the process of turning it into insight requires access to more information.

Documentation about the contents of the dataset, notes on how it was collected and processed, and any known limitations with its quality are all important to deciding when and how a dataset might be used.

Users should be able to easily find and access this contextual information. Where possible it should be packaged with the dataset to support downloading and redistribution.

  1. Make datasets legible

Statistical datasets can be very complex. They can include multiple dimensions and use complex hierarchical coding schemes. Terms used in the data may have specific statistical definitions that are at odds with their use in common language. Individual data points may even have annotations and notes, for example, to mark provisional or revised figures.

This information needs to be as readily accessible as the data itself. This makes it easier for re-users to understand and correctly interpret the data. Ideally definitions of standard attributes, dimensions and measures should all be independently available and accessible, especially where these are reused across datasets.

  1. Data should be useful for everyone

Open formats and standards ensure that data can be used by anyone, without requiring proprietary software or systems. But there is no single approach to consuming and reusing data. Treating data as infrastructure means recognising that there are a range of communities interested in that data and they have different needs.

Supporting these user needs may require presenting a choice of formats and data access options. Some users will want customised downloads while others may want to automatically access data in bulk or via APIs.

The GDS registers framework is a good example of a system that supports multiple ways to access, use and share the same core data.

  1. Make data part of the web

Hopefully, as the other principles make clear, a dataset doesn’t stand alone. There’s a whole collection of supporting documentation, definitions and metadata that helps to describe it. And, surrounding that, are all of the other outputs of the ONS: the bulletins, visualisations and other commentary that threads together multiple datasets.

Regardless of the technology used to manage and publish data, everything that a user needs to refer to or share should have a place on the web.

Collectively these principles should hopefully give us a framework that will guide both the work carried out on the alpha but also beyond. Over the coming weeks I’ll be turning these principles into suggestions and recommendations for how to manage and publish open data as part of the ONS website.

If you’ve got feedback or comments then I’d love to hear from you!

The ‘emotional’ side of data

The following blog post is written by Karen Gask, Data Scientist.

Working in our Big Data team means working with large datasets and looking at a wider variety of data sources than in traditional statistical work. This includes data from images and from text. We have been exploring how to analyse and use such sources in the team. We have been learning Natural Language Processing techniques to improve our skills in text analysis and text mining. Here are a few ways we have been getting our hands dirty with this type of data.

What is Natural Language Processing?

Natural Language Processing can help us understand lots of text in an automated way, especially where the text might be so big that it might be infeasible for us to read it all. Some methods are aimed at differentiating between emotions while other methods are better for classifying text talking about different things or for retrieving the answer to a question.

So how can Natural Language Processing be applied in official statistics?

Here are some examples from our work:

Classification problems

It is important for Census Field Operations to know where people are living and where they are not. During the 2011 Census we repeatedly tried to contact people in properties which were actually vacant. If we can identify vacant properties in advance, we’ll save money.

We manually classified 500 descriptions of caravans for sale or rent from property websites (such as Rightmove or Zoopla) into whether they were for holiday or residential use. From that we could see which words were most correlated with being in a holiday or residential description. Unsurprisingly, the words most correlated with holiday caravans included “pool”, “bar”, “restaurant” and “beach” and we were able to classify about 90% of descriptions accurately based on what we found. We are working with the Census Transformation Programme at ONS to evaluate whether this approach can be used on a larger scale.

Automated thematic analysis of text

The Sustainable Development Goals (SDGs) aim to end poverty, fight inequality and injustice, and tackle climate change by 2030. Goal 12 is to ensure sustainable consumption and production patterns. One of the indicators is “To encourage companies, especially large and transnational companies, to adopt sustainable practices and to integrate sustainability information into their reporting cycle”. This is an area for which no official data is collected. The data science techniques we have developed could fill that gap.

We’ve built programs to automatically find sustainability reports on the websites of 100 of the UK’s largest companies and found that 59 out of 100 had sustainability reports. We then analysed the sustainability text on their websites and found that the focus of their efforts varied depending on the industrial sector of the company. For example:

  • construction companies are more likely to focus on their environmental policies
  • the service sector is more likely to focus on charitable work

Explore an interactive visualisation of the words identified in the main 15 topics.

Analysing written responses to qualitative survey questions

Over the summer, a review of our Methodology divisions was undertaken and we were asked to provide a sentiment analysis from a survey of 120 staff. We found the majority of people like working in Methodology and find the work challenging.

We used the same methods for this work as this data scientist, who discovered that 2 people write Donald Trump’s tweets and that he writes the angrier ones.

Summary

Natural Language Processing is a growing area and we think there are opportunities for using these techniques in official statistics; either for producing new statistics or for improving operational processes such as coding.

Our next steps are working with internal crime and health teams … watch this space!

Can you think of any opportunities for analysing text in your work? We would love to hear examples of how these techniques are being applied! To share ideas, examples or chat about Natural Language Processing, contact Karen Gask or our Big Data team.

Introducing the Data Science Campus

[A guest post from David Johnson, Data Science Campus Start-up Manager]

“[Better use of data] has the potential to transform the provision of economic statistics, ONS will need to build up its capability to handle such data. This will take some time and will require not only recruitment of a cadre of data scientists but also active learning and experimentation. That can be facilitated through collaboration with relevant partners – in academia, the private and public sectors, and internationally.”

– Independent Review of Economic Statistics, Professor Sir Charles Bean, 2016, p.11

In 1971, the American psychologists Richard E. Nisbett and Edward E. Jones published their ‘Actor-Observer Bias’ theory. They proposed that we assign different causes to actions depending on whether those actions are carried out by ourselves, or by other people. For example, when we act in a certain way, we may explain our actions as being reactions to things that happen to us (I’m grumpy today because I missed my train and was late getting to work, but I’m actually a really happy person), but when we observe those same actions in others we assume them to be inherent traits (you are grumpy today because you are a very grumpy person).

I’m a big fan of the website FiveThirtyEight and my own train journeys are often filled with their podcasts. I heard a recent interview with one of their data journalists, Harry Enten, who when asked about his biggest mistake said it occurred when data didn’t fit his model and he chose to ignore it, unable to overcome his own bias.

If data professionals like Enten can fall foul of his own biases, how can the rest of us overcome this tendency and other challenges when it comes to the use and understanding of data? I recently had the opportunity to hear Professor Richard Nisbett speak about some of these challenges at the London School of Economics. He argued that we misunderstand data because we are not equipped with the right tools to understand it, joking that the way in which statistics is currently taught is designed “to prevent its extension to everyday life”.

I’m not sure if Sir Charles Bean was in the lecture hall that day, but shortly beforehand he had released the final report of his independent review of the quality, delivery and governance of UK economic statistics and, as I read it again later, Professor Nisbett’s words echoed in my mind.

The Bean Review concluded that measuring the modern economy requires new approaches and new tools. Across ONS a number of initiatives are underway to develop these, and the one that I’m spending all my time on (when not missing my train or listening to podcasts) is the new Data Science Campus at our headquarters in Newport. Launching later this year the Data Science Campus will establish a centre for Data Science and Data Engineering, bringing together Analysts, Data Scientists and Technologists from across the UK and the wider international community.

It will act as a hub for the whole of the UK public and private sectors to gain practical advantage from increased investment in data science research and help cement the UK’s reputation as an international leader in this field. By partnering with academia, industry and other areas of government, ONS will develop a greatly enhanced range of measures of the economy and society, so that emerging issues and trends can be spotted more quickly, understood in greater detail, and so that decision making can be better informed.

The goal of the centre will be to build a new generation of tools and technologies to exploit the growth and availability of innovative data sources and to provide rich informed measurement and analyses on the economy, the global environment and wider society.

Visit our website to find out more about the Data Science Campus, and get in touch if you are interested in partnering with us. We’ll also be blogging here regularly about our journey over the coming months.

I’m delighted to be a part of this journey. But am I happy because of the journey, or am I basically just a very happy person?

I think we need more data points to answer that.

Time for some (series) updates

Today we have launched some fairly substantial changes to the individual time series pages on the website, as mentioned in our last release note. This is the result of work and conversations over the last couple of sprints and is aimed to clarify this content and address some problems identified since we have launched.

Whilst these updates change the structure of these pages we have made sure that the current locations for any given time series do not break, including the ‘/data’ version. These URLs will continue to give the latest version of the data.

What’s different?

The website now offers an additional layer of information and options for each time series. These options are linked to the datasets that these time series are populated from and aimed to clarify to users exactly what data is being displayed.

Source dataset:

sourcedataset

The top block identifies the dataset you are currently viewing the data of. All the data shown will be from this particular dataset giving a consistent picture.

Other variations of this time series:

variationsoftimeseries

All other variations on this time series, and the dataset that updates them, are then available further down the page and can be viewed by following the links.

For an example, take a look at: http://www.ons.gov.uk/economy/grossdomesticproductgdp/timeseries/abmi/ukea

In addition each of these variations will be available separately from the time series tool.

Why change?

The aim of the time series structure implemented through the beta was to provide users with a consistent location where they could access the latest estimate for any given series. This structure also allowed us to support user needs such as being able to search by series ID.

Now we are into the production cycle on the new website we identified that the implementation did not support some of the ways we publish, where due to differences in the way revisions were handled or for consistency with the wider datasets these series, although having the same ID could have different values on the same day.

This meant we needed to keep the version of data loaded from a particular dataset consistent with all the other values, and length of series, in that dataset rather than updating a ‘master’ version of data on the website as new figures became available.


If you have any thoughts or comments on these changes or any other part of the site please do let us know by email, the comments on this blogpost or on Twitter to @ONSdigital.

What we can do with prices data scraped from the web?

ONS has recently published updated research into using web scraping technologies in the calculation of consumer price statistics. Read for more information.

My name is Tanya Flower. I work in the Prices Division at ONS, on the prices web scraping project. As Jane Naylor, Head of the Big Data team at ONS, mentioned in her last blog, this is one of a number of projects investigating the benefits and the challenges of using such data and the associated technologies within official statistics. Prices Division together with the Big Data team and Methodology colleagues have been working to investigate how price data from on-line supermarket chains could be used within prices statistics.

Capture-scrapy
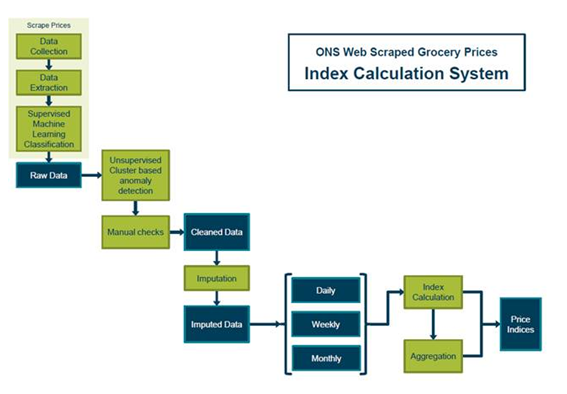
The growth of online retailing over recent years means that price information for many goods and services can now be found online. Web scrapers are software tools for extracting these data from web pages. The Big Data Team has developed prototype web scrapers for three online supermarket chains: Tesco, Sainsbury and Waitrose, which have been running since June 2014. These scrapers were programmed in Python using the scrapy module. Every day at 5.00 am the web scrapers automatically extract prices for 33 items in the Consumer Price Index (CPI) basket, covering things like bread and alcohol.

The web scraper uses the websites’ own classification structure to identify suitable products that fit within the CPI item description. For example, for the CPI item apples (dessert), per kg, products collected include Pink Lady Apples and Tesco Pack 4 Apples. The number of products extracted within each item category varies depending on the number of products stocked by each supermarket. On average over the period, approximately 5,000 price quotes are extracted by the web scrapers per day for the 33 items (approximately 150,000 a month). By contrast, the traditional collection approach for most grocery items is for a price collector to go into a local retailer once a month and collect prices for representative products. For these 33 items, this equates to approximately 6,800 a month.

Once collected, there are a number of steps involved in the development of experimental research indices using this data. Methodology and Big Data have been experimenting with machine learning techniques to identify misclassified items. These results are then validated using an algorithm designed to identify anomalies, such as a loaf of bread priced at £100, which returns a much more accurate and reliable source of price data than the raw data scraped from the website.


Capture-bd


Compiling high frequency data into price indices presents a unique set of challenges, which must be resolved before the data can be put to effective use. We may see differences in price levels or price dynamics depending on the choice of index compilation method or type of good.

For more information about this work, and a list of upcoming planned methodological developments for ONS web scrapers in the next 6-12 months, please see the recent update we published on the 23 May: “Research indices using web scraped price data: May 2016 update”.

This update includes an interactive tool, which is a useful to compare different indices across items and frequencies.

Introducing the Big Data team


My name is Jane Naylor and I’m Head of the Big Data team at the ONS. The team was established in January 2014 and brought together staff with a mixture of statistical, methodological and IT backgrounds with an enthusiasm and interest in data science and data engineering.

The key aims of the team are to demonstrate the potential for using big data within official statistics, to investigate the methodological and technological issues and other challenges and to develop skills and capability within ONS.

We adopted a dual approach to this work; undertaking hands-on pilot work with new data sources, tools and technologies and also exploring collaborative and partnership opportunities with a range of different external partners.

I can’t possibly summarise everything that we have done over the past 2 years but hopefully this post will provide a high level overview of key activities to date.

What have we been working on?

Over the last 2 years, the team have undertaken a number of pilots to demonstrate the potential benefits (reduced collection/production costs, improved quality, new types of outputs) and also tackle the challenges (statistical, technical, ethical, commercial) of the use of big data within the production of official statistics. These pilots have also allowed the team to develop new data science skills.

There are many different definitions of ‘big data’ but quite simply we have interpreted it as ‘alternative’ or ‘new forms’ of data. Official statistics are traditionally produced using survey, Census or administrative data – we focus on data sets that don’t fit within these 3 types. For example, to give you a flavour, we have undertaken research to try to answer the following questions:

  • Can geo-located Twitter data provide new insights into population and mobility?
  • Will data on utility usage provide a good indicator of vacant properties and hence allow us to be smarter about the way we conduct our Census or surveys, i.e. saving the tax payer money?
  • Rather than collect price data (that feed through to our economic outputs) by manually visiting stores, isn’t it more efficient and can’t we collect more data more frequently if we scrape prices from supermarket websites?
  • Can Oyster card data from tube travel in London be used to understand travel and commuting patterns?
  • What additional intelligence about properties in a certain area can we automatically gather from housing websites such as Zoopla that will help us when we undertake a survey or Census?
  • By analysing the difference between the number of electricity meters in an area with the number of addresses can we identify areas where properties have been demolished, there has been significant development or where there are large residential establishments?
  • How can mobile phone data be used to produce statistics for the population and population mobility? We haven’t actually had access to any data here but we have learnt a lot about the challenges of trying to do so!

It’s important to remember that in order to produce statistics using big data sources we are only interested in trends or patterns that can be observed at an aggregate level, not personal data about individuals. However, we recognise that accessing data from the private sector or from the internet may raise concerns around security and privacy. We have therefore only accessed publically available, anonymous or aggregated data within these pilots, All of our work fully complies with legal requirements and our obligations under the Code of Practice for Official Statistics and aspects of our work has been scrutinised by the National Statisticians Data Ethics Committee.

As well as exploring new data sets we have also investigated and developed new methods in order to process and analyse the data. We have used machine learning, clustering algorithms, text string analysis, data visualisation methods as well as traditional statistical approaches. In addition, the team are using new (for ONS), mostly open source technologies; we are programming in languages such as R and Python, processing and storing data using technologies such as MongoDB, Neo4j, Spark and Cassandra.

Who have we been working with?

We recognise that data science is multi-disciplinary and multi-institutional and we have been working with a range of different external organisations to learn from their experience and expertise, to coordinate efforts, to work collaboratively and to acquire data:

  • Government: We are key players (along with the Cabinet Office, Government Digital Service and Government Office for Science) in the virtual Government Data Science Partnership that was established to explore the opportunities for data science in Government and to embed a data-driven approach within professions and departments. We have also engaged with specific departments to share experiences and expertise.
  • Academia: Data science is a growing discipline within academia – recognising this we have worked collaboratively with a number of different universities and academic bodies.
  • International bodies: We are contributing to international initiatives in this area such as a UNECE Big Data Project and a Eurostat Big Data Taskforce, working, coordinating and sharing expertise with other National Statistical Institutes who are undertaking similar work to us and addressing similar challenges.
  • Commercial organisations: In some cases the engagement is focused on acquiring/purchasing data for research purposes in other cases to share experiences and understand how data science is impacting on their business.
  • Privacy groups: Many of the data sets we are exploring raise ethical and privacy issues. At ONS we are committed to protecting the confidentiality of all the information that we hold and addressing issues around ethics and privacy. We have therefore engaged with a number of privacy groups and ethical experts to seek advice and feedback.

What’s next?

The work of the Big Data team continues. Many of the pilots described above will be taken forward and developed further over the next year. We will also be taking on new pilots and identifying new areas where big data can make an impact on official statistics. In particular the recent announcement of more investment in data science at the ONS following the Bean Review will bring us lots of new challenges and opportunities.

A key challenge will be to move some of these pilots from research into implementation – using the new data sources, tools and techniques within the production of an official statistic.

Want to know more?

Please also look for future posts about the work of the team or email us directly –> ons.big.data.project@ons.gsi.gov.uk.

Dueling with datasets

As you will already have noticed, there have been some big changes to the way data is structured on the new website. The /data feature has already been discussed on the launch post so instead this will be looking in more detail at the changes to our other datasets and the journeys designed to get you to them.

Back in the discovery phase before the Alpha and Beta we started looking at how the (mostly) Excel spreadsheets we publish could be better presented on the site. When talking to users some clear issues came up over and over again about the way we were making these available on the (now old) website. We boiled these down into a number of user needs;

  • access to historic data
  • context – don’t make me download the data to find out what is in it
  • be sure the data I am looking at is the latest estimate available
  • to find previous versions of tables
  • be able to search effectively for data both on site and through Google
  • be able to re-find data I use regularly
  • clear access to supporting information

There were others, but these were the key ones we felt the new website could, and should, be addressing.

Looking back

So before I explain the new approach, it is probably worth a quick review of how data was structured on the old website. Each reference table, as they were named, was linked to a release; every time this was published a new version of this table was created, at a new location. These were presented as title and a short description and linked directly from a list attached to the given release. In addition to this the files were available to download directly from any search results and the latest 6 were displayed on any related taxonomy pages.

The tables themselves fall into two rough camps; tables which contain the entire historical data for the statistics they contain, and tables where this history is split over multiple files, and on the old website therefore multiple releases.

Moving forward – how is this different on the new website?

The first step we made to address the needs outlined above was to break the link between the release and the dataset, and instead looked to treat these as their own page. Whilst this introduces an extra ‘click’ into some journeys it offers some immediate benefits and some we will be looking to build on longer term.

The biggest benefit of this approach is that it gives a singlular place where any given dataset will be located – with all future updates made to that page rather than creating a new version in a new location. This makes it possible for users to bookmark tables they use frequently and for search engines to index the site more effectively.

Having a specific page for a dataset also means we can bring together into one place all the historic data. Previously for you would have had to locate each of these table separatly on the website in order to see how these figures have changed over time. This change in particular became very popular and tested really well with users. For example:

dataset

Going away from publishing separate versions at different locations and instead having a single location, that displayed the latest estimates by default, added the challenge of providing access to these old versions. To address this need each specific spreadsheet has its own version history that users can look back through to see what estimates were at a given date via a ‘view previous versions’ link below the download.

What’s next

There is still a way to go in addressing some of those initial user needs and there are a number of key areas we will be looking at going forward. Language and titling of all of our statistics is something we need to improve and these datasets are no exception. Looking at how we can clearly identify to users exactly what data they will receive when they click on any given link is going to be critical in solving this problem. The title is a big part of this, but the solution likely involves other aspects of these new dataset pages as well and the idea of clearly identifying the dimensions and breakdowns included in each dataset is something that has come up in testing and we will be looking to work towards.

We also know that there are some areas of the site where the volume of data we produce makes the ordering of the datasets a key tool for providing a logical structure and getting users to the data they require. On the old site this was often achieved by using table IDs preceding titles to force these pages into a specific order. Whilst this worked well on some of the pages, on others (particularly in the search results) it made these datasets difficult to scan. On any page where we list items we provide a text filter to help users narrow down the results and the intend is to build on these filters over time and provide additional tools to find specific datasets.

Hopefully these changes will reflect the testing we have done on them and prove useful for users. Ultimately one of the benefits of this approach is that it gives us a solid base to build and iterate upon as we continue to look to make getting to data as easy as possible. If you have any thoughts or comments on this  please do let us know by email, the comments on this blogpost or on Twitter to @ONSdigital.