Decoding Discovery

The ‘discovery’ phase of any digital undertaking is vital as it lays the foundation of any successful project. Unfortunately like many lessons from agile and the service design world it seems like a desire for a uniform, measurable approach in some organisations is creating obstacles to the technique being as impactful as if could be.

The GDS Service Manual does seems to contradict itself somewhat →

A short phase, in which you start researching the needs of
your service’s users, find out what you should be
measuring, and explore technological or
policy-related constraints.

It seems to me people get hung up on short phase.

Turn the page though (metaphorically) and you get this →

What to find out in discovery

In the discovery phase you need to understand and map out the user journey.

You should find out:
• who your users are
• your users’ needs and how you’re meeting them, or any needs you’re not meeting
• which services currently meet your users’ needs and whether they’re government services or private sector
• how you’d start developing a new service if your discovery finds there’s a user need for one
• the people you need on your team for the alpha phase
• what the user journey for someone using your proposed service might look like
• how you might build a technical solution given the constraints of your organisation’s legacy systems
• the policy that relates to your service and how it might prevent you from delivering a good service to your users

Which depending on problem in front of you might be anything but short.

I prefer this from the Australian Digital Transformation Office on the topic

There’s no one-size-fits-all duration for a Discovery,
however, many teams spend between four and six weeks.

I think that is more realistic — especially once an organisation becomes more digitally mature and starts to have a better understanding of users and their needs (a real understanding backed by research rather than anecdote) but for some time initially there is a lot to learn and often years of misconceptions to shake off. This is not a short phase.

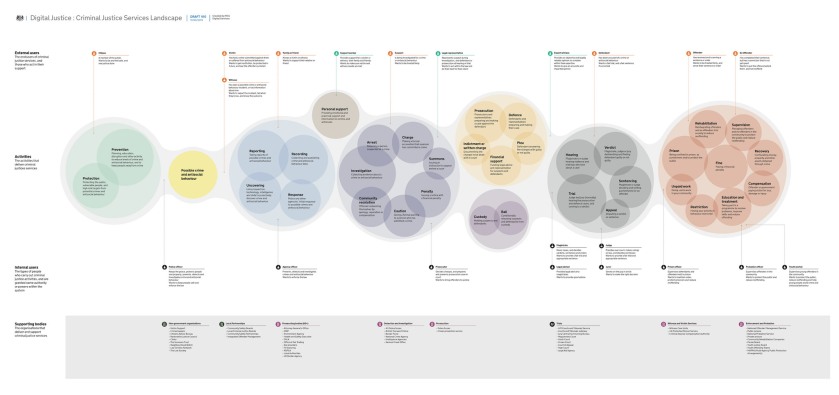
Sometimes the ‘discovery’ has a wide reach. One of my favourite pieces of work over the last few years was this massive service mapping exercise from the Ministry of Justice that span out of their ‘discovery’. To understand any one part of the journey they first had to understand the big picture.

20351061738_d7364ff18f_k

Here is another interesting example with a great team spending eight weeks looking at how the UK border effects trade. The findings from this ‘discovery’ was that they needed to do additional — more specific — discovery work.

On the other hand Sarah Prag suggests an experienced, mature team can “rattle through (discovery) in a week or two” in the right circumstances.

Like our antipodean cousins say “there’s no one-size-fits-all duration for a Discovery”.

I think rather than get hung up on timeframes we should think about the ‘minimal viable discovery’ to get started (because that is all this is — enough information to get started — you should never stop learning about your users and should be prepared to course correct as you learn more — other wise we are just playing at being agile.)

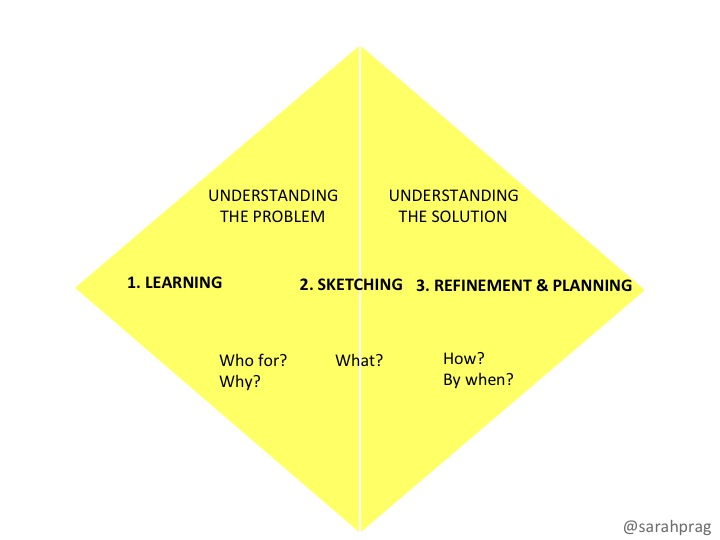
Personally I like to be able to confidently answer the questions in Sarah’s diamond (below) but your mileage may vary. Maybe you want answers to all the GDS questions above, or the DTO version or maybe even the Design Council ‘double diamond’ technique. As long as you learn what you need to learn to move to the next phase with confidence then it takes as long as it takes — whether that be two weeks or twelve. Don’t rush understanding your users — getting that right will underpin everything you do from that point on.

slide01

The First XI: ONS Digital Publishing principles

It is de rigueur for digital teams to have a set of operating principles these days. There is even a site that collects them all in one place. The ONS Digital Publishing team is no different.

Back in May we ran a contest for the team(s) to generate our own principles and then voted on which should make the final list.

The ONS Digital Publishing team is, as the name would suggest, a large publishing operation rather than the kind of transactional digital service that many of the GDSesque projects tend towards. Our teams include journalists, publishers, designers, data visualisation experts, sub-editors as well as user researchers, developers, delivery managers, interaction designers and analysts. I think this mix of backgrounds and skills makes us quite a unique ‘team of teams’ and our principles reflect that.

  1. Always put our users first
    We always start with our users. We ask, observe, analyse and act based on their needs. We don’t make assumptions. We don’t listen to the loudest voices. We aren’t swayed by internal politics.

We have empathy for our users. We are their voice internally

2. Less process, more progress
Sometimes we carry out tasks and we’re not sure why but we’ve always done it in a certain way. It’s important we focus on the value and benefits each task has so we can cut out some of the process to free up time to work on better stuff.

3. Be agile
Agile is not a set of rules to be followed but rather a set of principles to aspire to. We strive to be agile rather than to work in a specific Agile method.

We follow the Agile Manifesto:

• Individuals and interactions over processes and tools
• Working software over comprehensive documentation
• Customer collaboration over contract negotiation
• Responding to change over following a plan

4. Data informs decisions
We do not make assumptions or partake in guesswork. Decisions are informed by data wherever possible. Data needs to be put in context though and should be considered alongside user research and domain understanding.

To paraphrase Jim Barksdale, former Netscape CEO;

“If we have data, let’s look at data. If all we have are opinions, let’s go with Laura.”

5. Share and be open
We should share what we’re doing whenever we can. With colleagues, with users, with the world. Share code, share designs, share ideas, share intentions, share failures. The more eyes there are on a service the better it gets — howlers are spotted, better alternatives are pointed out, the bar is raised.

6. Keep improving
We iterate and we try to continuously improve. The website will forever be a work in progress — we will add features, remove elements that don’t meet user needs, improve the infrastructure, refine tools based on feedback. This makes big failures unlikely and turns small failures into lessons.

This is not just a technology principle though. We will keep iterating and improving every aspect of how the division operates.

7. Never fail, always learn
You can only fail if you don’t learn from your mistakes. We have the skills and expertise to try out new things, they might not always work but we learn from each experience until we create something that is perfect and something we couldn’t have thought of initially.

8. Focus on positives, act on negatives
Everyone remembers a time when they have received negative comments but it’s often hard to remember all the great feedback you’ve had for your work. A single negative comment can ruin a day, but it’ll take much more than one positive to make a day. We’ll focus on what we’re good at and react to constructive feedback to improve our work.

9. Publishing is a team sport
Publishing is our core business. Every member of the Digital Publishing Division contributes to ensure that we achieve that day in and day out. Publishing Support are the front-line but everybody has a role to play.

The better everybody understands everybody else’s roles the more successful we will be.

10. Specialists, not silos
The relationships we have with business areas, other teams across the organisation and external experts help us to be the best we can be. We must work with other people to ensure we utilise the right specialisms to create the best possible products, wherever those specialisms might be.

11. Be inclusive not exclusive
Accessible design is good design. Everything we build should be as inclusive and understandable as possible. While we may sacrifice elegance in search of being inclusive we never sacrifice accuracy.

Our website should be useful to experts but not exclusively so. Our audience is wider than that and whatever we present should reflect that.

A dashboard for the UK (and other conceits)

One of the things you will hear from agilistas at GDS and further afield is ‘show the thing’. The idea is that you need to get something, anything really, in front of users (and stakeholders) as early and often as possible to get real feedback about something real rather than just reiterating a set of ambitions or ideas via Powerpoint or Outlook.

It is a powerful tactic.

The thing is though you have to decide on something to actually build at some point.

During our somewhat extended ’discovery’ period we gathered a great deal of information on what our users actually needed and what they expected but at some point decisions needed to be made about how to translate those needs onto screens for them to interact with (and potentially tear down.)

It is at this point that Sharpie scribbles on scraps of paper start taking on increased importance and the search for other inspiring websites becomes slightly more desperate.

We settled on a broad hypothesis to test and a handful of principles we wanted to apply to that hypothesis.

The ONS website should be a data dashboard for the UK.

That simple statement was at the heart of every decision we made and to enforce the idea there were five design principles behind it;

  • The visual identity of the site would be defined by data visualisation. There would be no stock photography or decorative images.
  • The figures would be the headlines. We would make the pages ‘glanceable’ with the key figures standing out and acting as calls to action to find out more rather than hidden amongst dense text.
  • The design would be ‘mobile-first’ to prepare for the ongoing shift of our audiences from desktops to mobile devices.
  • Site search would be front and centre of every page.
  • We would accept that most people come via Google so every page would be a ‘landing page’.

The hypothesis and the principles were entirely influenced by the user research we had up until that point but they were very much my interpretation (with help from my team) so we needed to build something quick, show people and see to what extend it held up.

This has been a constant process now since the launch of the Alpha 18 months ago and over time the site has evolved and some things worked out better than others.

To be honest the thing that has worked least well was the initial main hypothesis — we never really found a way to make the homepage of the site live up to that ideal and it also became clear over time that it wasn’t something that held up as a real user need under deeper scrutiny. The homepage remains something of a quandary to be honest even after all this time.

Also it has to be said that mobile traffic didn’t really grow as expected — I stand by the decision to make the site work well on all devices but we have actually stalled at about 15% of traffic from mobile for a couple of years now. A large enough number to take it seriously but not the explosion other sites have seen.

Our search strategy remains pretty sound albeit it always needs improving. Having the large central search box on each page was jarring for some users initially and we did look at shifting it to the more familiar position on the top right of the layout but actually the feedback quickly reassured us that we were on the right track. The complexity of the site (despite all our efforts) means search is often the most convenient way for users to find what they are looking for so making it a clear focal point on the site makes sense. Externally Google continues to grow as a source of traffic to the site — sometimes reaching almost 70% — so our tactic of making the site more search friendly is also proving successful.

Internally the move to a site without ‘decoration’ was sometimes a little controversial — a lot of effort had been made in the months preceding the new project to make the ONS website more inviting and that had included a lot of images and colourful infographics — much of which we stripped away.

The reality is that users either didn’t notice that the images had gone (as they had always subconsciously dismissed them) or appreciated the new clean and focused look of the site. The prominence of charts and other data visualisations was immediately (and remains) popular. I have to be honest if I had remained product lead for the site I would have softened my stance on this over time — I think we had to clear the decks and then make some sensible decisions about the wider user of imagery longer term but the decision still seems valid.

So that is a little bit of behind the scenes information about why the site looks like it does these days — thanks to Jonathan, the team at CX and Onkar all of whom were instrumental in the thinking behind it all — and to Crispin and Jon who ended up building an awful lot of it!

Making life hard to make things easier

This is our particular take on principle four – Do the hard work to make it simple and it centres around probably the most controversial decision we made – at least in a particular corner of technically astute observers.

The questions is always variation on the following;

Why the heck did you build your own content management system rather than use Drupal/Wordpress/Joomla/Sitecore/Reddot/Liferay (the list is endless and you can delete as appropriate.)

This wasn’t a decision we took lightly and we looked hard at a number of the major open source CMSs out there but for what it is worth this was the thinking behind the decision – I’m not sure there is a right answer but I stand by what we chose.

We came to the project with some clear objectives and any publishing application was going to need to support them –

  • the ability to consistently publish within 60 seconds at 09.30
  • a platform that was optimised for continuous integration..
  • ..and automated testing
  • a secure platform where we had control as much as possible of the technical security
  • cloud ready
  • sustainable codebase..
  • ..and one we could recruit developers to support
  • an application that supported data visualisation as the primary visual language
  • a public website that was as performant as possible

Applications like Drupal (which I’ll use as the example as it was the closest to being used) come with a great many benefits as so much of the thinking around the standard use cases for web publishing has been done and tools built to support them. There is a large community and a ready pool of developers to get things working quickly and successfully.

The issue for us – and this is where you have to make a call and not everybody will agree – is that our main use cases for our application tended to be edge cases for the wider Drupal (and all the others) community. If we were to use something ‘off the shelf’ the team would have had to strip out a lot of un-needed / un-wanted functionality and add a fair amount of custom features – leaving only the skeleton of the original software and that created concerns about how maintainable it would be and started to dilute the advantages of using an existing product.

The feeling was we would quickly end up carrying weight (and risk) from a load of features we didn’t need and be committed to a product where the roadmap didn’t align to our needs which could potentially end up with us stranded on an old version due to the amount of customisation we would need.

Alongside this the teams we were talking to with the closest use cases to us (in particularly the GDS and Guardian development teams and later the Telegraph as well) had gone the DIY route.

The preference of the development team was to go with something lightweight, open source but bespoke – taking lessons from the GDS work but building something specific to our needs. It was about this time we started to talk about this as;

..a bespoke configuration of existing open source components

A decision needed to be taken and with the evidence at hand it was clear that there were strengths and weaknesses either way but given the preferences of the team, the work of GDS and the other organisations we spoke to with complex publishing operations I approved the direction to create ‘Florence & Friends’ which made up our platform.

It was certainly not a straightforward decision and created a LOT of pain for the team in the early days – there is a great deal of ‘water carrying’ going on in the background of modern CMSs and that all needed to be replicated but the freedom to be laser focused just on our user needs and to boil everything down to the MVP to get stats published allowed us to be build something and get it launched on schedule.

While currently far from perfect it has provided a real foundation for our ongoing ambitions while supporting the daily publishing schedule and successfully separating business process from web publishing.

The big question when you look back at difficult decisions like this is ‘would you do it again?’. Honestly there were times during the Beta when if you had asked me that the answer would have been a resounding ‘heck no!’ but with a little space now and looking at what was achieved I continue to stand by the decision and firmly believe it has provided us with something that will work better for our needs in the medium and long term in a way the other options wouldn’t have (though they may well have provided a less painful short term!)

Blogging to make things open

The Government Digital Service (GDS) have been the catalyst for an awful lot of change in the last five or six years but two relatively unheralded things they did early on actually had the biggest influence on me and the way I encouraged my colleagues in Digital Publishing (and beyond) to operate.

If people are aware of the GDS Design Principles at all it is almost always in relation to the first of the ten principles –

Start with needs
user needs not government needs

This is very much the superstar of the principles and one I forever hold close to my heart. That said it wasn’t and isn’t the one that influenced me most.

Make things open:
it makes things better

This was the point that really got under my skin — working open is a game changer and when combined with working in line with the first principle? This is how you ‘transform’ organisations.

The other thing GDS did — something that now seems such a small thing — is that they set up a blog really early (at the time just paying for a WordPress.com premium blog — cost approx $99) and shared….and shared…and shared. They made things open from day one.

So when I joined Laura at ONS the first significant thing I did was set up this very blog. Like the original GDS blog I got it up and running on WordPress.com — unlike the GDS blog I used my own credit card to get rid of the ads and use a custom domain. It took a few days to get the domain sorted but then we were up and away.

In the early days it was primarily just me blogging — I was a man on a mission and that mission was to change the perception of digital operations at ONS both internally and externally.

The website had come in for a huge amount of (mainly justified) criticism but what was lost from the narrative was just how hard people behind the scenes were working to fix things. People were pretty battle scarred and I was determined to give them a voice but also to open up a dialogue with as wide a constituency of users of the ONS website as possible.

The first post was June 24th 2013 and it was noticed by a few people;

We were open and honest from the start and over three years have (now) published 232 posts. The top five most viewed posts in that time have been;

(5) Use your y-axis

(4) A social media whirlwind. But a good one.

(3) “Official data, new light” — introducing Visual.ONS

(2) Can you help us test our new online questionnaires?

..and number one by a landslide →

(1) New ONS website launched

Now there are a couple of notable things to mention here — the first is that none of those posts were written by me (which probably says something about my writing!) but more importantly the posts come from the Social Media, Data Visualisation, Digital Content, Electronic Data Collection and Beta teams — which shows that it evolved past being a one person platform and become something used by across our digital teams.

In recent weeks the ‘Big Data’ and ‘Data Science Campus’ teams have published popular posts, the social media and user research teams collaborated on a post, the EDC team posted about their adventures at Civil Service Live and the web development team continue to use the blog to share their progress.

From a personal point of view I have a few favourite posts — this one by Phil and Jonathan about the user research approach during our website alpha is a perennial favourite. The work the Social Media team (and friends) did to live tweet the budget is an example I continue to use when I am out and about as is their work with our expert statisticians on Twitter. The two posts of my own I look back at with most fondness are this one summarising the final retrospective from the Beta team and this one introducing the website Alpha which basically was the starters gun for the race to deliver the new site.

Oh and I still laugh at the blogging as therapy post that is this one by Jonathan about the travails related to the site homepage (still not really resolved!)

The team has big plans for this blog and I feel confident that it is in good hands after I move on — the important thing to remember is still;

Make things open:
it makes things better

It really does.

Release note – Sprint 10

Time series tweaks

We’ve built on the time series work from last sprint, adding support for the new structure to the time series explorer tool, and improving the metadata returned in our search results. We’ve also completed the testing and migration of time series content to the new structure in our test and production environments.

Front-end focus

We spent two days researching some changes to our front-end web service. While the existing codebase was successful in delivering our goals during the beta, we took the opportunity to look at what we’d built to ensure its sustainable and extensible going forward – particularly as we’ll soon be building on our platform to support small area and geospatial data.

We built a number of alternative implementations of our front-end service, focusing on different parts of the codebase (for example templating, design patterns and web frameworks). This helped uncover some complexity in our existing design, and the lessons we’ve learned from the spike will be carried forward into future development work.

Our next steps will be to review the output of the spike, identify specific areas which need improvement, and integrate those changes into our technical roadmap for the months ahead.

Git flow, pull requests and code reviews

Throughout the alpha and beta we’ve been a bit too relaxed about our development practices, and we’ve been caught out a couple of times with bigger than intended releases. As our permanent team is now in place we felt it was a good time to start making some improvements.

From the start of our next sprint we’ll be using the Gitflow branching model, and as part of that we’ll be using GitHub pull requests to manage our workflow, with all pull requests tested and code reviewed by another member of the team.

Bug fixes and iterations

  • We’ve made some additional improvements to our PDF downloads, adding support for data tables to the PDFs of some  additional page formats, and pre-generating PDFs for all the formats.
  • Our Excel data downloads now correctly format number values as numbers, instead of returning them as a text value. This will apply to all Excel time series data we publish going forward.

Looking for a Product ONSer

At the moment ONS is having something of a hiring blitz in the digital and technology space — there are currently a bunch of brilliant roles being advertised (I’d particularly like to draw attention to the UX and User Research jobs that are still open) but the vacancy closest to my heart is the Product Owner position that will work with my former team.

Now I recommend you rush over to the job description and check that out then come back if you are still interested..

giphy

…welcome back.

We are looking for someone experienced who won’t be put off joining an established, but expanding, team with a challenging roadmap ahead — including some specific major improvements to the publishing platform and front-end that will add capability to properly support ‘small area’ statistics and generally better support ONS geospatial operations.

You’ll work in a truly multidisciplinary team alongside software engineers, interaction & content designers, user researchers, subject matter experts and delivery support. The team will be a mix of civil servants and third-party suppliers and every effort is made to operate as a single team without silos or cliques. A lot of effort has gone in to nurturing a positive culture and hopefully this is something that is quickly noticeable.

The team works in a pretty self organising manner, using agile approaches — without getting hung up on any specific flavour of ‘Agile’ — and have an open approach to improving the approach so there will be a real opportunity to stamp your own personality on the way things work.

ProductONSers.001

Given my own predilections I tend to think that Product Owner/Manager roles are extremely important to the success of any digital undertaking and the fact that by their very nature the roles require you to have your fingers in many pies means the person doing the job often finds themselves with a uniquely broad perspective of the work. That is going to be vital here — launching the new ONS website and publishing platform was barely the start of what needs to be done and there is much to do — thankfully a lot of it is truly interesting.

The commitment to being user driven is obvious in everything the team does and you’ll be supported by two user researchers from the very start — with considerable discovery work already available and significant technical lessons learned to contribute to any future thinking.

So hopefully that has piqued your interest — if you have any questions please do ask — either here in the comments or tweet @ONSdigital , me at @jukesie (my DMs are open if you want to be discreet!) or the Service Manager for ONS.GOV.UK Andy who is @mr_dudders.

Andy is going to being sharing details about the future roadmap in the near future so keep an eye out for that (subscribe to this blog or follow @ONSdigital to be sure) if you want to know what you could be getting yourself in to!

bn-apply-here

What we can do with prices data scraped from the web?

ONS has recently published updated research into using web scraping technologies in the calculation of consumer price statistics. Read for more information.

My name is Tanya Flower. I work in the Prices Division at ONS, on the prices web scraping project. As Jane Naylor, Head of the Big Data team at ONS, mentioned in her last blog, this is one of a number of projects investigating the benefits and the challenges of using such data and the associated technologies within official statistics. Prices Division together with the Big Data team and Methodology colleagues have been working to investigate how price data from on-line supermarket chains could be used within prices statistics.

Capture-scrapyThe growth of online retailing over recent years means that price information for many goods and services can now be found online. Web scrapers are software tools for extracting these data from web pages. The Big Data Team has developed prototype web scrapers for three online supermarket chains: Tesco, Sainsbury and Waitrose, which have been running since June 2014. These scrapers were programmed in Python using the scrapy module. Every day at 5.00 am the web scrapers automatically extract prices for 33 items in the Consumer Price Index (CPI) basket, covering things like bread and alcohol.

The web scraper uses the websites’ own classification structure to identify suitable products that fit within the CPI item description. For example, for the CPI item apples (dessert), per kg, products collected include Pink Lady Apples and Tesco Pack 4 Apples. The number of products extracted within each item category varies depending on the number of products stocked by each supermarket. On average over the period, approximately 5,000 price quotes are extracted by the web scrapers per day for the 33 items (approximately 150,000 a month). By contrast, the traditional collection approach for most grocery items is for a price collector to go into a local retailer once a month and collect prices for representative products. For these 33 items, this equates to approximately 6,800 a month.

Once collected, there are a number of steps involved in the development of experimental research indices using this data. Methodology and Big Data have been experimenting with machine learning techniques to identify misclassified items. These results are then validated using an algorithm designed to identify anomalies, such as a loaf of bread priced at £100, which returns a much more accurate and reliable source of price data than the raw data scraped from the website.


Capture-bd


Compiling high frequency data into price indices presents a unique set of challenges, which must be resolved before the data can be put to effective use. We may see differences in price levels or price dynamics depending on the choice of index compilation method or type of good.

For more information about this work, and a list of upcoming planned methodological developments for ONS web scrapers in the next 6-12 months, please see the recent update we published on the 23 May: “Research indices using web scraped price data: May 2016 update”.

This update includes an interactive tool, which is a useful to compare different indices across items and frequencies.

Introducing the Big Data team


My name is Jane Naylor and I’m Head of the Big Data team at the ONS. The team was established in January 2014 and brought together staff with a mixture of statistical, methodological and IT backgrounds with an enthusiasm and interest in data science and data engineering.

The key aims of the team are to demonstrate the potential for using big data within official statistics, to investigate the methodological and technological issues and other challenges and to develop skills and capability within ONS.

We adopted a dual approach to this work; undertaking hands-on pilot work with new data sources, tools and technologies and also exploring collaborative and partnership opportunities with a range of different external partners.

I can’t possibly summarise everything that we have done over the past 2 years but hopefully this post will provide a high level overview of key activities to date.

What have we been working on?

Over the last 2 years, the team have undertaken a number of pilots to demonstrate the potential benefits (reduced collection/production costs, improved quality, new types of outputs) and also tackle the challenges (statistical, technical, ethical, commercial) of the use of big data within the production of official statistics. These pilots have also allowed the team to develop new data science skills.

There are many different definitions of ‘big data’ but quite simply we have interpreted it as ‘alternative’ or ‘new forms’ of data. Official statistics are traditionally produced using survey, Census or administrative data – we focus on data sets that don’t fit within these 3 types. For example, to give you a flavour, we have undertaken research to try to answer the following questions:

  • Can geo-located Twitter data provide new insights into population and mobility?
  • Will data on utility usage provide a good indicator of vacant properties and hence allow us to be smarter about the way we conduct our Census or surveys, i.e. saving the tax payer money?
  • Rather than collect price data (that feed through to our economic outputs) by manually visiting stores, isn’t it more efficient and can’t we collect more data more frequently if we scrape prices from supermarket websites?
  • Can Oyster card data from tube travel in London be used to understand travel and commuting patterns?
  • What additional intelligence about properties in a certain area can we automatically gather from housing websites such as Zoopla that will help us when we undertake a survey or Census?
  • By analysing the difference between the number of electricity meters in an area with the number of addresses can we identify areas where properties have been demolished, there has been significant development or where there are large residential establishments?
  • How can mobile phone data be used to produce statistics for the population and population mobility? We haven’t actually had access to any data here but we have learnt a lot about the challenges of trying to do so!

It’s important to remember that in order to produce statistics using big data sources we are only interested in trends or patterns that can be observed at an aggregate level, not personal data about individuals. However, we recognise that accessing data from the private sector or from the internet may raise concerns around security and privacy. We have therefore only accessed publically available, anonymous or aggregated data within these pilots, All of our work fully complies with legal requirements and our obligations under the Code of Practice for Official Statistics and aspects of our work has been scrutinised by the National Statisticians Data Ethics Committee.

As well as exploring new data sets we have also investigated and developed new methods in order to process and analyse the data. We have used machine learning, clustering algorithms, text string analysis, data visualisation methods as well as traditional statistical approaches. In addition, the team are using new (for ONS), mostly open source technologies; we are programming in languages such as R and Python, processing and storing data using technologies such as MongoDB, Neo4j, Spark and Cassandra.

Who have we been working with?

We recognise that data science is multi-disciplinary and multi-institutional and we have been working with a range of different external organisations to learn from their experience and expertise, to coordinate efforts, to work collaboratively and to acquire data:

  • Government: We are key players (along with the Cabinet Office, Government Digital Service and Government Office for Science) in the virtual Government Data Science Partnership that was established to explore the opportunities for data science in Government and to embed a data-driven approach within professions and departments. We have also engaged with specific departments to share experiences and expertise.
  • Academia: Data science is a growing discipline within academia – recognising this we have worked collaboratively with a number of different universities and academic bodies.
  • International bodies: We are contributing to international initiatives in this area such as a UNECE Big Data Project and a Eurostat Big Data Taskforce, working, coordinating and sharing expertise with other National Statistical Institutes who are undertaking similar work to us and addressing similar challenges.
  • Commercial organisations: In some cases the engagement is focused on acquiring/purchasing data for research purposes in other cases to share experiences and understand how data science is impacting on their business.
  • Privacy groups: Many of the data sets we are exploring raise ethical and privacy issues. At ONS we are committed to protecting the confidentiality of all the information that we hold and addressing issues around ethics and privacy. We have therefore engaged with a number of privacy groups and ethical experts to seek advice and feedback.

What’s next?

The work of the Big Data team continues. Many of the pilots described above will be taken forward and developed further over the next year. We will also be taking on new pilots and identifying new areas where big data can make an impact on official statistics. In particular the recent announcement of more investment in data science at the ONS following the Bean Review will bring us lots of new challenges and opportunities.

A key challenge will be to move some of these pilots from research into implementation – using the new data sources, tools and techniques within the production of an official statistic.

Want to know more?

Please also look for future posts about the work of the team or email us directly –> ons.big.data.project@ons.gsi.gov.uk.

Meet the Service Managers

There is a great deal of ‘transformation’ underway at ONS these days — particularly in relation to our digital work. As part of this we have been recruiting some new faces to support our move to a new way of working. Tom, Andy and Chris have joined in the last few weeks to take up the new (for us) Service Manager roles in three of our major initiatives.

I’ll let them introduce themselves –


Tom Scott

@drtommac

AvatarI’m the Digital Service Manager for the Census. One way or another everyone in the UK is involved making the user needs complicated and diverse. I am really excited to see how we can take the biggest paper service in the country and make it user centred and digital by design. It is going to be a real challenge to run the Census itself not to mention the need to then share the results.

I’ve worked for the Government Digital Service (GDS) for the past few years in a variety of roles all focused on delivering products to meet the needs of users. My last role was the product manager for the redesign of the Service Design Manual, bringing together all the learnings that government has made from transforming services to meet user needs (and pass a Digital Service Standard assessment!), before I left we relaunched content around user research, working in an agile environment and understanding measuring the success of services.

Before GDS I worked at Apple where my experience was truly transformational. There is real empathy in the approach, being there to support people who do not understand their technology as well as helping those who want to maximise their usage. For me empathy is key to why we build services in the way we do.


Andy Dudfield

@mr_dudders

ad_photo
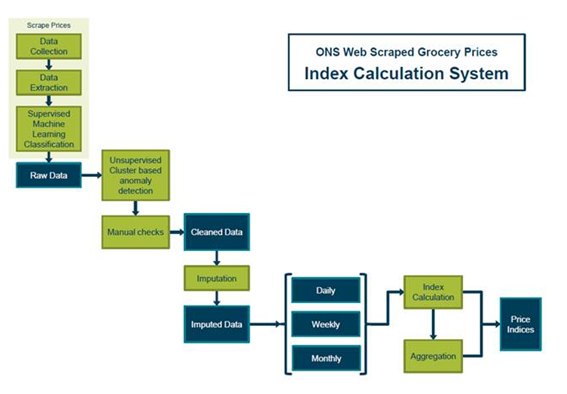
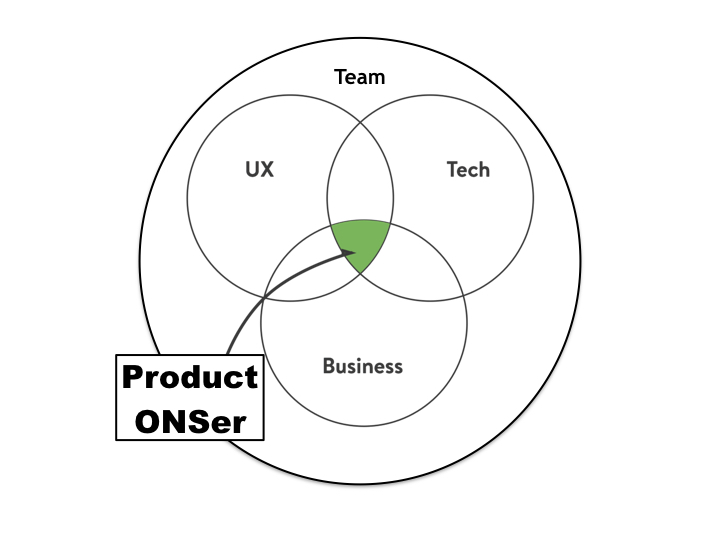
Prior to the ONS I worked in various digital and product roles at the BBC, most recently as product manager working for the Research and Education Space. This meant I was working across the BBC and many partner organisations around the themes of Linked Open Data and digital archives.

I have joined the ONS as a Digital Service Manager for publishing. This means I am responsible for our website, the presentation of content, the API that drives it and how we can ensure all parts of it continue to improve in line with the feedback of our audiences. I am excited to join such a strong team of talented digital folks working to provide such important information to a wide range of people.

My goal is to try and give the team here the best working environment and tools so that they can continue to deliver the best possible service.


Chris Mitchell

@chris_mitch

0df4828As Digital Service Manager for Electronic data capture I need to build on the great work that’s already been achieved, to deliver and run a world-class digital service based on user needs. The service covers digital products for respondents to manage and complete their questionnaires, securely message ONS and access support, as well as products to allow ONS staff to build digital questionnaires, manage how they are sent out, and support respondents to provide accurate data on time.

I’ve had 20+ years experience doing IT & digital transformation, most recently the GDS Transformation Lead for Lasting Power of Attorney exemplar and assurance lead for four high profile digital by default exemplars: Rural Payments Your Tax account, PAYE and Digital Self Assessment.

I’ve relocated to Cardiff for this job, so I’m looking to make a long term impact — there are some great people working here, so that’s going to make it a whole lot easier and fun too. I’m also really impressed with the facilities here. Coming from the cramped confines of London, the access to meeting rooms, impressive cycling facilities and a creche that’s bigger than my daughter’s old nursery feel like proper luxury!